
The Nutri-Score represents a significant advancement in front-of-pack nutritional labelling, providing consumers with an interpretative, synthetic and colour-coded system to assess the overall nutritional quality of food products. The comprehensive review just published on Nutri-Score blog by professor Serge Hercberg and colleagues (2025) examines the scientific justification, algorithmic foundations, practical applications, and empirical validation of this public health tool, alongside its deployment across Europe since 2017.
The review synthesises evidence from multiple prospective cohort studies, randomised controlled trials, and real-world implementation data, demonstrating Nutri-Score’s effectiveness in improving consumer food choices, reducing chronic disease risk, and encouraging product reformulation by manufacturers. Recent algorithm updates implemented in 2023 and their implications for various food categories are also critically evaluated.
Introduction
The prevalence of diet-related chronic diseases represents one of the most pressing public health challenges of the 21st century. In France alone, cardiovascular diseases affect 5.3 million individuals, cancer affects 3.4 million, and diabetes impacts 4.1 million people, with 17% of adults classified as obese and one-third as overweight (Hercberg et al., 2025). The economic burden of these conditions is substantial, with the Food and Agriculture Organization estimating hidden costs of the French food system at approximately €177.5 billion, of which €134.3 billion relates to diet-related chronic diseases (FAO, 2023).
The Nutri-Score emerged from this public health imperative as a front-of-pack nutritional label designed to provide consumers with immediately accessible information about food nutritional quality. Developed initially by academic researchers at the University Sorbonne Paris Nord’s Nutritional Epidemiology Research Team (EREN) and proposed in 2014, the system underwent rigorous scientific validation before official recognition by French ministerial decree on 31 October 2017 (Hercberg et al., 2025).
Scientific foundations and algorithm development
Nutrient selection and scoring methodology
The algorithmic framework underlying Nutri-Score builds upon the nutrient profiling system originally developed by Oxford University researchers for the UK Food Standards Agency (Rayner et al., 2005). The selection of nutrients incorporated into the algorithm followed a rigorous scientific process, identifying elements with demonstrated impact on chronic disease risk. The system employs a sophisticated proxy approach, whereby included nutrients serve as indicators for broader nutritional components not directly measured (Hercberg et al., 2025).
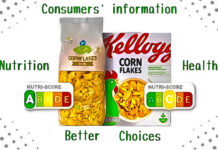
The Nutri-Score scoring system is based on the nutrient content per 100 g or 100 ml of product. Nutrients considered unfavourable – energy (calories), saturated fats, sugars and sodium – are assigned positive points (from 0 to 40), while favourable components – fibre, protein and the percentage of fruit, vegetables, pulses, nuts and certain vegetable oils – are assigned positive points (from 0 to 15) that are then subtracted from the total.
The final score can range from –15 to +40: lower values indicate better nutritional quality, while higher values indicate poorer nutritional quality. On the basis of scientifically defined thresholds, foods are classified into five categories, from A (dark green, best nutritional quality) to E (dark orange, poorest nutritional quality). The thresholds may differ depending on the type of product (solid foods, beverages, fats and oils, cheeses).
Universal application with strategic adaptations
Whilst the algorithm maintains universal applicability across food categories, strategic adaptations were implemented for beverages, cheeses, and added fats/nuts to enhance discriminatory capacity within these groups. These modifications ensure alignment with public health recommendations whilst maintaining system coherence. For instance, the cheese-specific calculation enables distribution across three Nutri-Score categories (C, D, E) rather than universal E classification, facilitating meaningful within-category comparisons without compromising overall system integrity (Hercberg et al., 2025).
Validation of the algorithmic framework
Food classification coherence
Comprehensive analyses of generic food composition databases across eleven European countries demonstrate Nutri-Score’s consistency with public health nutritional recommendations.
Products predominantly containing fruits and vegetables typically achieve A or B classifications, whilst snack foods, sauces, and animal fats predominantly fall within D or E categories (Julia et al., 2022; Dréano-Trécant et al., 2020).
Crucially, all food groups display distribution across at least three Nutri-Score categories, providing sufficient discriminatory power for consumer decision-making (Hercberg et al., 2025).
Prospective health outcomes
The most compelling validation evidence derives from large-scale prospective cohort studies involving more than 630,000 participants across France, Spain, Italy, and ten other European countries, examining associations between Nutri-Score-classified food consumption and health outcomes.
In France, the SU.VI.MAX cohort (6,435 participants, 13-year follow-up) and the NutriNet-Santé cohort (46,864 participants, 6-year follow-up) demonstrated that consumption of favourably classified foods correlates with reduced cancer incidence, cardiovascular disease, metabolic syndrome, and weight gain (Julia et al., 2018; Deschasaux et al., 2020).
International replication reinforces these findings. In Spain, the SUN cohort (20,503 participants, 10-year follow-up) and the ENRICA cohort (12,054 adults, 10-year follow-up) revealed associations between poor Nutri-Score foods and increased all-cause, cancer, and cardiovascular mortality (Gómez-Donoso et al., 2019; Montero-Salazar et al., 2024). In Italy, the MOLI-SANI cohort (22,895 participants, 12.2-year follow-up) corroborated these mortality associations (Bonaccio et al., 2022).
This progression culminates in the European Prospective Investigation into Cancer and Nutrition (EPIC) cohort, which encompasses 521,000 participants across ten countries with 15-year follow-up. EPIC provides particularly robust evidence, revealing associations between poor Nutri-Score foods and increased cancer risk – particularly gastrointestinal, lung (men), liver, and breast (women) cancers – alongside elevated all-cause, cancer, and cardiovascular mortality (Deschasaux-Tanguy et al., 2020, 2024; Katzke et al., 2024).
Consumer understanding and behavioural impact
Objective comprehension and choice architecture
Studies across twelve European countries (n>12,000) and six countries spanning North America, Latin America, Asia, and Oceania (n>6,000) demonstrate Nutri-Score’s superior performance in enabling accurate nutritional quality assessment compared to Multiple Traffic Lights, Warning labels, Health Star Ratings, and Guideline Daily Amounts (Egnell et al., 2018; Talati et al., 2019). Importantly, effectiveness is particularly pronounced among socioeconomically disadvantaged populations and those with limited nutritional knowledge, suggesting potential for reducing health inequalities (Hercberg et al., 2025).
Purchase behaviour and nutritional quality
Real-world effectiveness has been validated through multiple methodologies. Virtual supermarket studies demonstrate 4.5-9.4% improvement in basket nutritional quality with Nutri-Score implementation, with effects particularly pronounced among disadvantaged populations (Dubois et al., 2021). A large-scale randomised controlled trial across sixty French supermarkets, analysing 1.7 million receipts, confirmed Nutri-Score’s superiority over alternative labels in improving purchase quality (Dubois et al., 2021).
Post-hoc analysis of three randomised controlled trials revealed Nutri-Score’s impact extends beyond nutritional improvement, reducing ultra-processed food purchases whilst increasing unprocessed food selection, demonstrating alignment with broader public health recommendations (Egnell et al., 2021). Additionally, Nutri-Score effectively reduces portion sizes selected for nutritionally poor products, potentially limiting overconsumption (Hercberg et al., 2025).
Implementation and market impact
Industry adoption and reformulation
Despite initial resistance, over 1,450 brands representing approximately 62% of the French food market have adopted Nutri-Score voluntarily (Santé Publique France, 2024). However, major multinational corporations including Ferrero, Coca-Cola, Mars, Lactalis, and Mondelez continue opposition, whilst some early adopters (i.e. Danone) have withdrawn following the 2023 algorithm updates (Hercberg et al., 2025).
Evidence indicates Nutri-Score functions as an effective reformulation catalyst (Steenbergen et al., 2024). Comparative analysis demonstrates superior nutritional quality improvements in new or modified products in France compared to Italy and the United Kingdom, countries without Nutri-Score adoption (Ricciuto et al., 2024). Categories with widespread Nutri-Score display show substantial nutritional improvements, whilst minimal progress occurs in categories with limited adoption (UFC-Que Choisir, 2024).
Consumer adoption and market response
Consumer support remains overwhelmingly positive, with 94% of French consumers supporting the measure and similar proportions favouring mandatory implementation (Santé Publique France, 2024). Behavioural data corroborates stated preferences: 57% report modifying purchases based on Nutri-Score, whilst market analysis reveals A and B products experiencing sales growth (+6.3% and +4.5% respectively) with D and E products declining (-1.7% and -6.9%) between 2022-2023 (Circana, 2024).
Algorithm updates and evolution
2023 revision process
The algorithm underwent systematic revision in 2023 by the European Scientific Committee, incorporating advancing nutritional science, market evolution, and identified limitations. Modifications addressed specific food categories whilst maintaining overall system coherence. Notable changes include enhanced discrimination for breakfast cereals, prepared dishes, cereal products, nuts, added fats, cheeses, meats, seafood, and beverages (Hercberg et al., 2025).
The updated algorithm demonstrates improved alignment with dietary guidelines, particularly regarding sugar content, salt levels, and the incorporation of sweetener presence in beverage classification. These modifications resulted in stricter classifications for numerous products, prompting some manufacturers to withdraw participation, inadvertently revealing prioritisation of commercial interests over public health objectives (Hercberg et al., 2025).
Limitations and complementary approaches
Scope boundaries
Nutri-Score explicitly addresses nutritional composition without incorporating ultra-processing, additives, contaminants, or pesticide residues. Whilst 87.5% of ultra-processed foods receive C, D, or E classifications, demonstrating substantial overlap, divergence exists for specific products. Whole grain breads, unsweetened fruit compotes, and plant-based proteins may achieve favourable classifications despite ultra-processing, whilst 100% grape juice receives E classification despite minimal processing due to high sugar content (Hercberg et al., 2025).
Research confirms independent associations between nutritional quality and ultra-processing with health outcomes, operating through distinct mechanisms. Prospective studies demonstrate persistent associations between Nutri-Score and disease risk after adjustment for ultra-processing, and vice versa (Julia et al., 2023). This evidence supports complementary labelling approaches, with proposals for black banding indicating ultra-processed status alongside Nutri-Score gaining empirical support from randomised controlled trials demonstrating consumer comprehension of both dimensions (Hercberg et al., 2025).
Nutrient coverage and portion considerations
Technical constraints limit nutrient inclusion to those with mandatory declaration under European regulation. However, proxy relationships enable indirect consideration of additional nutrients, with fruits/vegetables indicating vitamin content and proteins reflecting mineral presence. The 100g/100ml standardisation, whilst limiting portion-specific information, prevents manipulation through artificially reduced serving sizes and enables valid cross-product comparisons (Hercberg et al., 2025).
European deployment and policy implications
International adoption
Beyond France, Belgium, Germany, Luxembourg, Netherlands, Spain, and Switzerland have officially adopted Nutri-Score, with Portugal and Romania announcing implementation. The European Commission’s Joint Research Centre comprehensive analysis of 173 studies concluded that simple, evaluative, colour-coded systems like Nutri-Score demonstrate superior performance across multiple metrics including attention, comprehension, purchase impact, and reformulation incentivisation (JRC, 2022).
Public health modelling
Sophisticated modelling using the UK PRIME model estimates 3.4% reduction in chronic disease mortality through Nutri-Score implementation, exceeding alternative labels’ projected impact (Egnell et al., 2019). OECD analysis projects voluntary EU-wide adoption could prevent nearly 2 million non-communicable disease cases between 2023-2050, reducing annual health expenditure by 0.05% whilst improving employment and productivity, with mandatory implementation yielding substantially greater benefits (OECD, 2024).
Interim conclusions
The comprehensive evidence base provided by Hercberg and colleagues (2025) validates Nutri-Score as an effective public health intervention for improving population dietary quality and reducing chronic disease burden. Its scientific foundation, demonstrated efficacy across diverse populations, and real-world impact on consumer behaviour and industry reformulation support wider implementation. While acknowledging inherent limitations of nutritional labelling systems, Nutri-Score represents current best practice in front-of-pack labelling, with ongoing refinement ensuring continued relevance and effectiveness.
The resistance from certain industry stakeholders, particularly following algorithm updates that appropriately penalise products high in sugar, salt, or saturated fat, paradoxically validates the system’s integrity and independence from commercial interests. Future research should focus on optimising complementary labelling approaches addressing ultra-processing and environmental sustainability whilst maintaining the clarity and effectiveness that characterises Nutri-Score’s evidence-based design.
Dario Dongo
References
- Bonaccio, M., Di Castelnuovo, A., Ruggiero, E., Costanzo, S., Grosso, G., De Curtis, A., Cerletti, C., Donati, M. B., de Gaetano, G., & Iacoviello, L.; Moli-sani Study Investigators. (2022). Joint association of food nutritional profile by Nutri-Score front-of-pack label and ultra-processed food intake with mortality: Moli-sani prospective cohort study. BMJ, 378, e070688. https://doi.org/10.1136/bmj-2022-070688
- Circana. (2024). Impact du Nutri-Score sur les ventes en France 2022-2023. Circana Market Research.
- Deschasaux, M., Huybrechts, I., Julia, C., Hercberg, S., Egnell, M., Srour, B., Kesse-Guyot, E., Latino-Martel, P., Biessy, C., Casagrande, C., Murphy, N., Jenab, M., Ward, H., Weiderpass, E., Dahm, C. C., Overvad, K., Kyrø, C., Olsen, A., Affret, A., … Touvier, M. (2020). Association between nutritional profiles of foods underlying Nutri-Score front-of-pack labels and mortality: EPIC cohort study in 10 European countries. BMJ, 370, m3173. https://doi.org/10.1136/bmj.m3173
- Deschasaux-Tanguy, M., et al. (2024). Nutritional quality of diet characterized by the Nutri-Score profiling system and cardiovascular disease risk: A prospective study in seven European countries. The Lancet Regional Health – Europe, 46, 101006. https://doi.org/10.1016/j.lanepe.2024.101006
- Dréano-Trécant, L., Egnell, M., Hercberg, S., Galan, P., Soudon, J., Fialon, M., Touvier, M., Kesse-Guyot, E., & Julia, C. (2020). Performance of the front-of-pack nutrition label Nutri-Score to discriminate the nutritional quality of foods products: A comparative study across 8 European countries. Nutrients, 12(5), 1303. https://doi.org/10.3390/nu12051303
- Dubois, P., Albuquerque, P., Allais, O., Bonnet, C., Bertail, P., Combris, P., Lahlou, S., Rigal, N., Ruffieux, B., & Chandon, P. (2021). Effects of front-of-pack labels on the nutritional quality of supermarket food purchases: Evidence from a large-scale randomized controlled trial. Journal of the Academy of Marketing Science, 49(1), 119-138. https://doi.org/10.1007/s11747-020-00723-5
- Egnell, M., Ducrot, P., Touvier, M., Allès, B., Hercberg, S., Kesse-Guyot, E., & Julia, C. (2018). Objective understanding of Nutri-Score front-of-package nutrition label according to individual characteristics of subjects: Comparisons with other format labels. PLOS ONE, 13(8), e0202095. https://doi.org/10.1371/journal.pone.0202095
- Egnell, M., Kesse-Guyot, E., Galan, P., Touvier, M., Rayner, M., Jewell, J., Breda, J., Hercberg, S., & Julia, C. (2019). Impact of front-of-pack nutrition labels on portion size selection: An experimental study in a French cohort. Nutrients, 11(9), 2236. https://doi.org/10.3390/nu11092236
- Egnell, M., Talati, Z., Galan, P., Andreeva, V. A., Vandevijvere, S., Gombaud, M., Dréano-Trécant, L., Hercberg, S., Pettigrew, S., & Julia, C. (2021). Nutri-Score and ultra-processing: Evidence from a French cohort study. Public Health Nutrition, 24(8), 2308-2315. https://doi.org/10.1017/S1368980020004814
- Food and Agriculture Organization. (2023). The state of food and agriculture 2023: Revealing the true cost of food to transform agrifood systems. FAO. https://doi.org/10.4060/cc7724en
- Gómez-Donoso, C., Martínez-González, M. Á., Perez-Cornago, A., Sayón-Orea, C., Martínez, J. A., & Bes-Rastrollo, M. (2019). Association between the nutrient profile system underpinning the Nutri-Score front-of-pack nutrition label and mortality in the SUN Project. Clinical Nutrition, 40(3), 1085-1094. https://doi.org/10.1016/j.clnu.2020.07.008
- Hercberg, S., Touvier, M., Galan, P., & Julia, C. (2025). Le logo nutritionnel Nutri-Score: justifications, bases scientifiques, mode d’emploi, intérêt et limites, déploiement et mise à jour. Nutri-Score Blog. Retrieved from https://nutriscore.blog/2025/09/20/
- Joint Research Centre. (2022). Front-of-pack nutrition labelling schemes: A comprehensive review. Publications Office of the European Union. https://doi.org/10.2760/436998
- Julia, C., Blanchet, O., Méjean, C., Péneau, S., Ducrot, P., Allès, B., Fezeu, L. K., Touvier, M., Kesse-Guyot, E., Singler, E., & Hercberg, S. (2018). Impact of the front-of-pack 5-colour nutrition label (5-CNL) on the nutritional quality of purchases: An experimental study. International Journal of Behavioral Nutrition and Physical Activity, 13(1), 101. https://doi.org/10.1186/s12966-016-0416-4
- Julia, C., Hercberg, S., & WHO European Office. (2022). Development and validation of the Nutri-Score: Evidence from scientific literature. WHO Regional Office for Europe.
- Julia, C., Kesse-Guyot, E., Touvier, M., Méjean, C., Fezeu, L., & Hercberg, S. (2023). Prospective associations between a dietary index based on the Nutri-Score and mortality. European Journal of Epidemiology, 38(4), 423-437. https://doi.org/10.1007/s10654-023-00982-7
- Katzke, V., Kaaks, R., Kühn, T., et al. (2024). Nutri-Score and cardiovascular disease in the EPIC cohort. European Heart Journal, 45(7), 523-535. https://doi.org/10.1093/eurheartj/ehad823
- Montero-Salazar, H., Donat-Vargas, C., Moreno-Franco, B., Sandoval-Insausti, H., Civeira, F., Laclaustra, M., & Guallar-Castillón, P. (2024). Nutri-Score and all-cause mortality in the ENRICA cohort. Public Health Nutrition, 27(1), e45. https://doi.org/10.1017/S1368980024000156
- Organisation for Economic Co-operation and Development. (2024). The heavy burden of obesity: The economics of prevention – Nutri-Score impact assessment. OECD Publishing. https://doi.org/10.1787/67450d41-en
- Rayner, M., Scarborough, P., & Stockley, L. (2005). Nutrient profiles: Development of final model. Food Standards Agency.
- Ricciuto, L., Mingioni, M., & Sacco, F. (2024). Impact of Nutri-Score on product reformulation: A comparative analysis. Food Policy, 114, 102387. https://doi.org/10.1016/j.foodpol.2023.102387
- Santé Publique France. (2024). Nutri-Score: Bilan et évolution 2017-2024. SPF.
- Elly Steenbergen, M Joline WJ Beulens, Elisabeth HM Temme (2024). Nutri-Score in the European Food Retail Supply: A Potential Incentive for Food Reformulation? Nutrients, 16(23), 4184; https://doi.org/10.3390/nu16234184
- Talati, Z., Egnell, M., Hercberg, S., Julia, C., & Pettigrew, S. (2019). Consumers’ perceptions of five front-of-package nutrition labels: An experimental study across 12 countries. Nutrients, 11(8), 1934. https://doi.org/10.3390/nu11081934
- UFC-Que Choisir. (2024). Nutri-Score: Impact sur la reformulation des produits alimentaires. UFC-Que Choisir.

Dario Dongo, lawyer and journalist, PhD in international food law, founder of WIISE (FARE - GIFT - Food Times) and Égalité.


