
NutriScore is the only front-of-pack nutrition labeling system supported by extensive scientific evidence, clarifies Professor Serge Hercberg in an italic discussion of FOPNL systems (Front-of-Pack Nutrition Labelling) where he was invited to contribute, only to be censored to leave only space for supporters of the Nutri(dis)inform.
Below, we publish the answers given by Professor Serge Hercberg – Professor Emeritus of Nutrition at Sorbonne University Paris-Nord – to questions proposed by journalist Chiara Dalla Tomasina, at an event (‘The evolution of Italian and European agribusiness between sustainability and well-being‘) organized by Withub in Rome on March 9, 2023.
Italian consumers – once again deprived of the right to correct and complete information, in a food sector where the media are on the leash of Coldiretti and big advertisers (e.g., Ferrero), as this writer has repeatedly denounced – meanwhile, they rely on the Yuka app, based precisely on NutriScore, to learn about the nutritional profiles of foods.
1) What do you think of the Nutrinform battery, the proposed Italian alternative to the NutriScore? And what do you think are the critical issues?
(a) Nutrinform is a very complex logo to understand and interpret.
Nutrinform provides monochromatic numerical information for each nutrient. In principle and in its graphical representation, Nutriform is very close to the “GDA/Reference Intake” system developed by manufacturers in the 2000s (see figure below). Furthermore, the Italian government, in the decree notified to the European Commission, refers to this derivation, stating that theReference Intakes (RI) was used as the scientific basis for Nutrinform.

However, all independent scientific studies show that GDAs/RIs are difficult for consumers to understand and interpret and do not allow them to compare foods at the time of purchase. They do not have a positive impact on consumer buying behavior. The Nutrinform battery system is very similar to the GDAs/RIs, which, because of their complexity, have been rejected by the vast majority of consumer associations in Europe and by public health facilities that, for many years, have supported the principle of a colorful, gradual, synthetic logo, which has been scientifically proven to be more effective.
As well as the GDA/RI logo proposed by manufacturers a few years ago, Nutrinform (which is inspired by GDA/RI) Is particularly complex to interpret because it presents a very large amount of information (as many as 15 figures) that is difficult to synthesize for the consumer at the time of purchase, for whom decisions are made in seconds or tens of seconds. The system is even more complex and difficult to understand because the numerous pieces of information presented use different references: nutrient amounts given in relative terms are calculated for one serving, while the percentages presented refer to the reference intake for an average adult (2000 Kcal/d), and caloric intake is expressed per 100 g of food.
(b) Nutrinform’s batteries are counterintuitive to consumers.
Particularly counterintuitive appears to be the battery symbol, which represents the nutrient content of the food through the icon traditionally used to monitor the charge of a phone or household appliance, but which curiously in Nutrinform it should be interpreted in the opposite sense (The more “low” the battery, the better the nutritional quality of the food!). This has been highlighted by many scientists and consumer associations, particularly in Italy (Altroconsumo) and at the European level by BEUC (which groups 46 European consumer associations).
In addition, the percentages can be interpreted as a goal to be reached at the end of the day by adding up all the foods consumed. Actually, from a scientific point of view, for those nutrients that should be restricted in the diet, Nutrinform indicates a maximum not to be exceeded. Therefore, the information provided is actually misleading to the consumer.
Finally, aside from its counterintuitive form, the battery used in Nutrinform to inform about the portion’s contribution to total daily intake of sugars is based on European legislation and considers 70 grams as the daily reference intake. This is significantly higher than the WHO-recommended 50-gram limit as a benchmark, which can mislead consumers in terms of assessing the sugar content of foods, underestimating the actual contribution of the food to reaching the maximum amount of sugar that should not be exceeded.
(c) Nutrinform is based on portions (as required by many industrialists): a questionable reference for specific foods
Another major shortcoming of the Italian batteries is that they are calculated on a portion basis and not on a universal reference of 100 g for food (or 100 ml for liquids). Yet, this is a recommendation of WHO and public health facilities to be able to compare foods objectively on the same basis and avoid using portions that are difficult to standardize with real scientific basis for specific foods. In fact, the standard portion sizes that should be “benchmark recommended” differ depending on individual energy needs.
Energy needs vary according to age (they are different for children, adolescents, adults, the elderly, etc.), gender (men/women), physical activity/sedentary, pregnancy, etc. It is therefore Scientifically questionable and misleading to refer to a single reference portion that is the same for everyone to calculate the contribution to coverage of recommended nutritional intakes, which in turn varies among individuals. Nutrinform uses a single reference to calculate the coverage of individual needs: those of an average adult consuming 2000 Kcal/d (which does not correspond to the reality of the consumption of women, children, adolescents, elderly individuals, etc.).
While this is the only reference proposed by the INCO regulation, the use of a calculated reference for adults can be particularly misleading for products intended for children, such as cakes or pastries, for which nutritional references are much lower. This could lead to excessive intake of nutrients that should be limited, such as sugar or saturated fat.
In addition, the individual portions set by Nutrinform are set for large food groups (which can include a great variability of foods within the group) and correspond to “standard reference” portions that are different from and often far removed from those proposed by manufacturers on packages (which also vary by brand) and even more so from those actually consumed by consumers. There is a risk of discordance between the portion recommended by the manufacturer and the portion used to calculate Nutrinform.
Finally, even if it were possible to provide nutritional information per serving, it is still very difficult for consumers to assess what it corresponds to in practice, unless they have a scale and weigh the food.
The reference to portions (required by many manufacturers) is therefore questionable and may be misleading to consumers. In addition, one study (1) showed that unlike the NutriScore (which refers to 100 g of food), the use of a logo for each nutrient referring to portions, theEvolved Nutrition Label, ENL, which was proposed in 2016 by a group of 6 industrialists (Coca-Cola, PepsiCo, Mars, Mondelez, Nestlé, and Unilever) has not led to a reduction in the portion sizes of products of low nutritional quality and, indeed, tended to increase the size of the portions for cream spreads because it falsely reassured consumers.
To avoid all these problems, the use of a standard quantity, such as 100g (or 100 ml) is an appropriate choice, a common denominator that allows a valid comparison between foods without inducing estimation errors: compare 100 ml of olive oil with 100 ml of another oil; 100 g of breakfast cereal with 100 g of other cereals; 100 g of a pizza with 100 g of another pizza; 100 g of Comté with 100 g of Camembert or Roquefort or Mozzarella.
We often hear that consumers do not consume 100 g of cheese or butter or 100 ml of olive oil at the same time. Of course, but consumers do not take a “standard portion” either, since the actual portion consumed depends on individual factors, as mentioned above. Therefore, the use of a standard portion, if it is close to individuals’ consumption patterns, is actually misleading, as it can be misinterpreted as the amount actually taken in by the consumer, who cannot reasonably perceive these subtleties.
Again, the nutritional logo cannot be seen as a precise nutritional recommendation on how the food should be consumed (assuming that this can be standardized), but simply as a means of providing universally understandable information on the overall nutritional composition of foods and to enable rapid comparison of differences in nutritional composition between foods intended for the same purpose or consumed under the same conditions. The use of a standard amount (100g/100 ml) is most appropriate. Such as the presentation of the price per kilogram, which is widely used to inform the consumer and compare the price of products and is well accepted by all (even if, again, we do not consume 1 kg of butter, cheese, spreadable cream or 1 liter of oil).
(d) Nutrinform is not based on scientific studies demonstrating its proper understanding, use, and impact on the nutritional quality of consumer purchases (unlike NutriScore)
A useful nutritional logo must have a solid scientific basis in its construction and demonstration of its effectiveness. To judge the quality and potential value of a nutrition table, one must be able to evaluate both the adequacy of the algorithm underlying its calculation and the performance of its graphical format. WHO has published a conceptual outline and detailed process (2) describing the different steps required to evaluate a nutritional logo. Not all stages have the same significance in terms of demonstrating the relevance and effectiveness of a nutritional logo. For example, the graphic format of a nutrition logo may be well perceived and appreciated by consumers, but that does not mean it is well understood and well used to make favorable nutrition choices. Therefore, it is important to judge the effectiveness of a nutritional logo not only by consumer perception or preference, but more importantly by whether it is really useful to consumers and leads to a limitation of energy, fat, and sugar intake such that the nutritional status of the population is improved. NutriScore is the only nutrition logo that has passed the entire conceptual scheme and the various stages of the validation process recommended by WHO.
If we study the scientific literature, there are many studies on GDAs/RIs proposed by industry in the 2000s (the logo on which Nutrinform is based), but there are few on Nutrinform. What can be seen from the analysis of the work on GDA/Ri is their total ineffectiveness and lack of positive impact on consumer purchasing behavior, and in particular on their nutritional quality (which is the goal of a nutrition label). In addition, GDA/Ri are often used as a “control” group (the equivalent of a placebo in drug studies) in logos efficacy studies.
For example, objective comprehension studies in more than 18 countries (3) (including 12 European countries) comparing 5 nutrition logos (including NutriScore and GDA/RI) have shown that NutriScore was the most effective logo in helping consumers compare the nutritional quality of foods, while GDA/RI was the least helpful nutrition logo consumers to correctly classify foods according to their nutritional quality. This study was also conducted on 1023 Italian consumers. (4) The observed results are identical to those of other countries, i.e., GDA/RI was found to be the least effective nutrition logo among all those tested, showing no difference in impact compared to the baseline situation without any nutrition logo. Overall, the GDA/RI (very similar to the Nutrinform model and format) provides no benefit to consumers.
On the other hand, other studies (5) that tested the direct impact of different logos (including NutriScore and GDA/RI) on food choices under real-world conditions, conducted in online supermarkets, virtual stores, or a large number of supermarkets, showed that NutriScore was effective in improving the nutritional quality of the baskets and had a greater impact than all the other logos tested. In these randomized trials, the GDA/RI logo (whose model is very similar to Nutrinform) did not improve shopping baskets. NutriScore is the logo associated with the best overall nutritional quality in the shopping cart, both in the general population and in the most nutritionally vulnerable populations: disadvantaged populations, underserved consumers, students, and patients with chronic diseases.
Unlike the NutriScore, there are no studies evaluating the impact of Nutrinform on food choices and nutritional quality of baskets under real-world conditions. However, Nutrinform is very similar to GDAs/RIs, which were not found to be effective in the various studies that tested them.
There are three published Italian studies that conclude that Nutrinform is preferred over NutriScore by consumers. (6) However, the methodology of these studies must be taken into consideration, as they focus on the subjective understanding of logos, a dimension that is similar to logo perception/preference. Even if a nutrition logo is well perceived by consumers, this does not mean that it is well understood, well used, and has an impact on food choices and nutritional quality of purchases. In order to assess these key dimensions, it is necessary to measure objective understanding and effect on food choices, which have not been covered in the Italian studies.
Instead, three studies involving French, Spanish, Italian, and Portuguese teams compared not only perceptions and preferences, but also consumers’ objective understanding of NutriScore and Nutrinform in Italy, Spain, and Portugal. (7) All three studies show that in terms of objective understanding (an important condition for defining the quality of a nutritional logo), the NutriScore is significantly associated with a better/increased ability of consumers to identify more health-promoting foods in all food categories tested compared to NutrInform. The NutriScore was also perceived as significantly easier to use than NutrInform. Finally, in these studies the NutriScore was associated with better food choices, with reduced energy, sugar, and fat in selected products compared with NutrInform. Interestingly, in the category of added fats, the NutriScore increased the probability of selecting olive oil among the different fats compared to NutrInform.
It should also be noted that The 3 Italian studies that found a more favorable result for Nutrinform, regardless of the fact that they considered only subjective (and not objective) understanding, were funded by Federalimentare (the Italian Federation of Food Industrialists “which represents and protects the Italian food and beverage industry” and has been fighting NutriScore and supporting Nutrinform for years). It should be remembered that many studies have shown links between the funding of a study and the direction of its results. (8) For example, in studies on the deleterious effects of sugar-sweetened beverages published in the international scientific literature, it has been shown that the direction of the articles’ conclusions is significantly associated with the source of funding. Industry-funded publications are 8 times more likely to have an industry-friendly conclusion, that is, to demonstrate a positive effect of the product on health. This raises the issue of economic conflicts of interest and bias in nutrition.
But above all, what is important to consider from a scientific point of view is that the results of the Nutrinform and NutriScore studies, without private funding, are totally in line with the conclusions of the report of the EC Joint Research Center (published in 2022) (9) which, after a very comprehensive review of the scientific literature, clearly concludes on the Superiority of color interpretive systems (such as NutriScore) compared to monochromatic information systems (such as NutrInform).
(e) Nutrinform, a logo supported by industry and rejected by consumers
In general, the Nutrinform system is totally rejected by consumer associations (including BEUC, which represents 46 consumer associations, FoodWatch, which is present in several European countries, etc.), which consider it incomprehensible and misleading. On the other hand, Nutrinform is supported by the agribusiness lobby, which sees it as a bulwark against NutriScore and as a way to preserve the image of made-in-Italy products.
2) ‘The NutriScore is an interpretive system and not educational/informative. It does not improve the nutritional knowledge of the consumer, who expects the score to be accepted uncritically. It provides no help in choosing the overall composition of the diet, nor does it facilitate an appropriate combination of various foods’. How do you comment on this observation?
Scientific evidence favors interpretive systems (NutriScore type) for consumers over informational systems (Nutrinform type)
The review of the scientific literature clearly concludes that interpretive nutrition logos are better understood by consumers than purely informational formats, particularly among vulnerable populations with lower socioeconomic status (10,11).
In September 2022, the European Commission’s Joint Research Center (JRC, the European Commission’s in-house scientific service that conducts research and provides independent, evidence-based scientific advice in support of EU policies) published the results of four scientific reviews on consumer information on food.
Regarding front-of-pack nutrition labeling, the 230-page scientific report signed by 13 international scientists from the JRC analyzed 173 documents using a rigorous methodology extensively described in the report. He reviewed scientific work on the different characteristics of nutrition logos: attention, consumer preferences and consent, objective understanding, impact on food purchase, the role of socioeconomic differences, implementation effects, diet and health, and food reformulation and innovation.
The main conclusions of this well-documented scientific work are (apart from general considerations about nutrition logos, such as the fact that consumers value the presence of nutrition logos on the front of food packages as a quick and easy way to obtain useful nutritional information at the time of purchase) that:
– the use of color makes nutrition logos more prominent and stimulates consumer attention,
– less complex nutrition logos require less time and attention to be processed by consumers,
– most studies suggest that consumers prefer colorful nutritional logos,
– overall, consumers seem to prefer simple, colorful and direct nutrition logos,
– studies show that simpler, evaluative and traffic light logos are easier to understand than more complex, non-evaluative and monochrome logos,
– in terms of impact on purchases, experimental studies suggest that colored logos are more useful than monochrome versions in encouraging consumers to buy healthier foods in general,
– low-income consumers seem to prefer evaluative nutrition logos.
As can be seen from this JRC report, NutriScore holds all the cards in terms of the positive characteristics of usefulness and effectiveness, being classified by the JRC as a simple, colorful, synthetic and evaluative nutritional logo, the calculation of which is based on a simple reference quantity (100g or 100ml).
In contrast, the Italian NutrInform battery system is classified as a monochromatic, non-evaluative and complex logo (corresponding to a type of logo considered by JRC analyses to be less well positioned in terms of usefulness and effectiveness).
(a) Would information systems really be educational and interpretive systems not?
There is total confusion maintained by detractors of the NutriScore who try to make out that informational logos (such as Nutrinform) would be “educational” as opposed to interpretive logos (such as the NutriScore). This is a claim without any real basis or scientific evidence.
There are in fact Official definitions for different types of nutritional logos: i logos interpretive provide an assessment/judgment of the nutritional value of a food product based on the information available on the back of the package (nutrients and/or ingredients), e.g., through colors or symbols, while logos informative reproduce some of the information available on the back of the package in a different graphic format, but without providing additional evaluation/judgment for the consumer.
Therefore, the purpose of an interpretive logo such as NutriScore is to provide concise information to help consumers guide their food choices toward foods of better nutritional quality (which has been proven by numerous scientific studies). This is not a standard, but a transparency on the overall nutritional quality of food assessed by a system based on sound science that consumers can incorporate into their purchasing decision if they wish.
No study has shown that an informational logo such as Nutrinform contributes in any way to consumer education. In fact, it simply provides the same information in graphic form as the nutrition table on the back of the package (with a representation in the form of stacks that consumer organizations find counterintuitive).
But in reality there is often confusion, maintained by those who want to harm the NutriScore, between the goals of nutrition education and those of a nutrition logo. Can we really think that the environment in which consumers shop, the supermarket in general, can be considered a suitable place for learning?
In fact,the main purpose of a nutrition logo is not to educate, but to help consumers, at the time of purchase, to put into practice the elements of nutrition education they receive elsewhere, enabling them to recognize the overall nutritional quality of foods and to compare products with each other to guide their choices toward foods of better nutritional quality, in line with nutritional recommendations and therefore more conducive to their health. It is a tool adapted to the environment in which it is to be used, complementary to other educational actions for the population. For consumers who so desire, detailed information on the composition of the product remains available on the back or sides of the package.
Nutrition education of consumers/citizens, which takes place through, among other things, nutritional recommendations (such as those in food guides) and nutrition logos, represents the expression of two different types of information whose development principles differ in various ways but are complementary. To understand the respective roles of nutrition guidelines and nutrition logos, as well as the complementarity and synergy between these two public health tools, it is essential to consider the differences in their respective goals and how they can and should be coordinated.
Public health nutrition guidelines provide the general framework for a healthy diet, which comes from eating a combination of general foods, both in terms of quantity and quality. These recommendations provide consumers with practical advice on what is considered a healthy diet, giving general information on the consumption of major food groups (fruits and vegetables, legumes, nuts, dairy, meat, added fats, sugary products, etc.). This information helps consumers to identify food groups whose consumption should be encouraged or restricted and to structure the diet over several days. A recommended quantitative consumption frequency is given for some of these food groups, such as “at least 5 servings of fruits and vegetables per day”; “fish at least twice a week”; “a handful of unsalted nuts per day”… For others, the advice is qualitative, such as “limit consumption of salt, sugar or fat,” “favor whole grains,” “favor plant products over animal products,” “limit ultra-processed foods,” and “eat fresh, homemade foods.”
These nutritional guidelines are designed to help consumers adopt a healthy diet. While it is possible to characterize a diet as “healthy” or “unhealthy” based on its association with the risk of various diseases (such as cancers, cardiovascular disease or type 2 diabetes, high blood pressure, etc.), the same cannot be said for individual foods. In fact, no food can be considered harmful or toxic as such, just as no food can be considered a universal panacea, although obviously some have more favorable nutritional compositions than others. It is the combination of food groups within an overall diet that defines it as more or less healthy or unhealthy. Unlike nutritional recommendations, which refer to generic food groups and the overall diet, nutritional logos assess the nutritional value of specific foods. Therefore, the Nutri-Score does not classify foods as “healthy” or “unhealthy” in absolute terms. Such a purpose for a nutritional logo would be questionable, since the absolute wholesomeness of a food depends on the amount consumed and the frequency of its consumption, but also on the overall dietary balance of individuals (knowing that overall nutritional balance is not achieved through the consumption of a single food, either over the course of a meal or even over the course of a day).
Moreover, even within the food groups that are the subject of public health nutrition recommendations, the specific foods that comprise them show great variability in terms of composition, especially when considering the range of industrial foods. For example, fish can be purchased raw, canned, smoked, breaded, minced… All these forms of fish can be found in the nutritional recommendations that serve as the basis for nutrition education in the generic group “Fish.” However, these various forms of fish have very different nutritional compositions. For example, salmon (like other fatty fish), depending on the form in which it is sold, may contain no salt (if it is fresh) or may contain up to 3 or 4 g of salt per 100 g if it is smoked (which corresponds to half or 2/3 of the maximum recommended daily intake of salt). The Nutri-Score makes it easy to objectify these differences in nutritional composition and thus provides valuable information (which contributes to nutrition education): fresh salmon is rated A, canned salmon is rated B, and smoked salmon is rated D. This information is particularly useful for consumers, since nutritional recommendations encourage the consumption of fish and especially fatty fish without providing further details. “Eat salmon, herring or sardines” is therefore part of the nutritional recommendations to educate consumers, but this message does not provide information on the nutritional differences of the various existing forms of these fish. Therefore, the Nutri-Score is really complementary to public health nutrition recommendations. It helps consumers easily adjust the amount and frequency of consumption of different types of fish according to their nutritional quality and allows them to eat fish (which is part of the recommendation) but to systematically avoid consuming fish containing high amounts of salt (limiting salt intake is also a public health nutritional recommendation). This situation is found in all food groups subject to the generic recommendations.
Similarly, within the food groups whose consumption should be restricted according to the recommendations (e.g., chips, sweets, cookies, pizzas), there is also wide variability in the nutritional composition of specific foods within them, in terms of salt, saturated fat, sugar, calories, and fiber. Therefore, although the generic recommendation is to limit the consumption of these products that are-for the most part-salty and/or sweet and/or fatty, The Nutri-Score can help consumers identify products with the least unfavorable composition, which is useful for the consumer, complements recommendations and contributes to consumer education.
The Nutri-Score also seems to be useful in showing consumers the main differences that may exist in the nutritional quality of food products with the same name (e.g., between “cheese pizzas,” “chocolate cookies,” “muesli”) but with different brands. Although nutritional recommendations remind that consumption of these types of foods should be limited overall, it is important to allow consumers to identify within these products the type or brand with better nutritional quality. This objectification by the Nutri-Score could also encourage companies to reformulate their products to match competitors (as observed in countries that have adopted the Nutri-Score).
In relation to nutritional recommendations, another point to consider is the promotion of unprocessed or minimally processed foods, including homemade products, and the recommendation to limit ultra-processed industrially produced products. These messages are conveyed in consumer recommendations. However, in the current European food context, time spent cooking and the use of fresh food for meal preparation-rather than mixing industrial ingredients-tends to decrease, especially in the younger generations, who are also the most at risk for obesity and overweight, especially in Italy. Analysis of trends in the food supply available to consumers shows that convenience foods and meals are a growing market. In light of these trends, the Nutri-Score appears to be a complementary strategy to recommendation messages to help consumers choose, among the many industrial foods available on the market, those that have better nutritional quality or those that are less nutritionally unfavorable. The general message is “choose fresh foods, but for the processed foods you buy, choose those with the best Nutri-Score.”
It goes without saying that if consumers want to eat a sandwich or tomato soup, they should ideally prepare it themselves with fresh food and good nutritional quality ingredients without additives. But if, due to lack of time, desire or means, they decide to buy a ready-made industrial sandwich or soup, it is preferable that they choose those of better (or lower) nutritional quality, which the Nutri-Score allows them to recognize!
In addition, there is a high degree of consistency between the public health nutrition recommendations that serve as the basis for nutrition education and the Nutri-Score food group classification on foods. The score distribution underlying the Nutri-Score calculation was analyzed in several food composition databases. Specifically, a study was conducted in 13 countries (France, Belgium, Spain, Germany, Switzerland, Italy, the United Kingdom, the Netherlands, Sweden, Austria, Finland, Poland, and Portugal). (12)
Most foods that contain mainly fruits and vegetables are classified as A or B, while most confectionery products are classified as D or E. This consistency is also found within the food groups themselves: in the starch group, legumes, pasta and rice are systematically ranked higher than breakfast cereals. In the dairy group, milk and yogurt are ranked higher than cheese. As for mixed dishes, there is a wide variability in the nutritional quality of products that fall into this category. As for beverages, while most juices are rated C, sugary drinks are rated E and only water is rated A, in line with nutritional recommendations.
Overall, the Nutri-Score appears to be consistent with the public health nutrition recommendations on which nutrition education is based for the vast majority of foods on the food market. Given the great variability in nutritional quality within the food categories to be promoted and those to be restricted, the Nutri-Score provides additional information to guide consumers toward foods with better nutritional composition (containing fewer unfavorable nutrients and/or more favorable elements). The NutriScore is a perfect complement to public health nutrition recommendations that serve as a basis for nutrition education. Of course, it is essential to implement appropriate communication that reminds people of the elements provided by each of these information (recommendations and nutrition logo). Basically, the principle of this consumer communication is: 1) It is advisable to follow nutritional recommendations to achieve overall healthy eating habits. These recommendations provide guidance on which generic food groups should be promoted or restricted, the frequencies of consumption of these food groups when specified, and favor fresh, homemade foods and reduce consumption of ultra-processed foods; and then 2) within these groups, we recommend using the Nutri-Score to choose those with better nutritional quality, within the category or among brands, and then adjust the quantity/frequency of food consumption.
The Nutri-Score is therefore not intended to replace nutritional recommendations, which remain the basis of nutrition education, but to complement them, to help at the time of purchase.
While public health nutrition recommendations are more or less the same in all European countries, communication and education strategies on the use of nutrition recommendations and the NutriScore need to be adapted to different cultural contexts, taking into account specific eating habits and traditions. Communication and education on this issue must mobilize all stakeholders: nutrition and public health facilities, nutritionists and dietitians, health workers, teachers, field workers, etc.
The validation of the nutritional profiling system underlying NutriScore and the demonstration of the effectiveness of its graphical format on the nutritional quality of purchased foods fully justify its implementation on food packages in synergy with generic nutritional recommendations. This is important because, in the absence of understandable information about the nutritional quality of foods, consumers are at the mercy of marketing of food companies using various strategies (advertising, subtle evocations on packaging, for example) to push for consumption of certain products that, from a public health perspective, should be restricted. In addition, growing consumer demand for healthy foods is driving industry to respond by flooding the market with heavily labeled industrial foods with health and nutrition claims that consumers have difficulty evaluating independently. In light of these trends, the Nutri-Score appears to be a practical aid for consumers in choosing more health- and nutrition-friendly foods at the point of sale to complement nutritional recommendations.
3) ‘As recent data show, Nutri-score does not promote adherence to the Mediterranean diet, which is the diet with the greatest evidence of anti-cancer effect.’ How do you respond to this statement?
To say that Nutri-Score does not encourage adherence to the Mediterranean diet is a totally false statement. They are the Italian charcuterie and cheese lobbies, sometimes conveyed by some politicians, who try to make people believe that Nutri-Score opposes the Mediterranean diet, arguing that Italian cured meats and cheeses are mainstays of the Mediterranean food model and that Nutri-Score would penalize these foods by classifying them as D or E (due to their high salt and saturated fatty acid content). This argument makes no sense.
In fact, for nutritionists and public health officials, the health-promoting Mediterranean diet model (and not only cancer, but also cardiovascular disease, obesity, diabetes, etc.) does not promote cheese and cured meats (Italian or otherwise). The Mediterranean diet is not limited to the consumption of pecorino romano, gorgonzola, prosciutto crudo or prosciutto di San Daniele (which are excellent products from a gastronomic point of view). The health-promoting Mediterranean dietary pattern, promoted by all nutritionists around the world (including the creators of the Nutri-Score), is characterized by a Abundant consumption of fruits and vegetables, legumes, whole grains and fish (products well ranked by the Nutri-Score) and by limited consumption of meat, cold cuts, and sweet, fatty, and salty foods (products less ranked by the Nutri-Score). In the Mediterranean model,olive oil should be favored among added fats, which is reflected in its C score (and soon to be B due to the Nutri-Score update in 2023), the best possible score for vegetable oils.
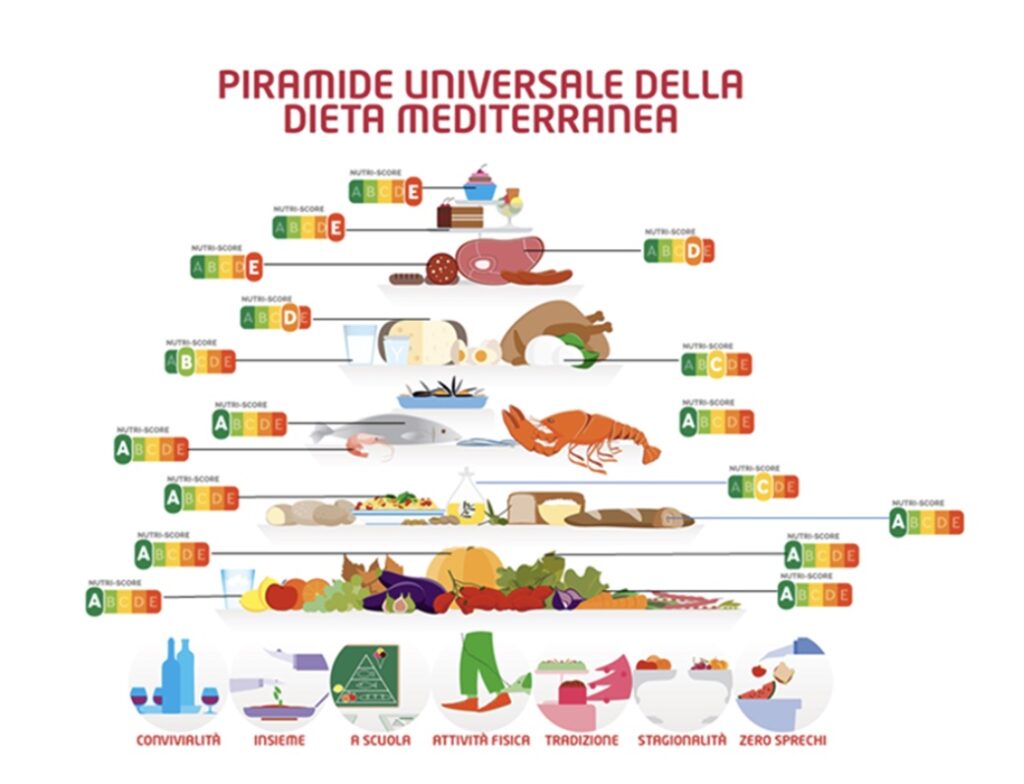
In addition, a study conducted on the application of the NutriScore to foods in Greece (13) showed an excellent correspondence between the Nutri-Score classification and the Mediterranean food pyramid. In Spain, the study conducted by the team in charge of the SUN cohort (14) showed that the algorithm for calculating the Nutri-Score is fully consistent with Spanish public health recommendations and the Mediterranean diet model (assessed by various indices) in a population of more than 20,000 Spanish participants followed for 10 years. Interestingly, the conclusion of the Spanish authors is that their results support the interest of implementing the Nutri-Score in European Mediterranean countries (including Spain, Italy, Greece).
The economic lobbies and their political referents try to create in their speeches a confusion between the symbolic foods of Italy’s gastronomic heritage and the foods promoted by the Mediterranean diet model. This has nothing to do with anything! It is in fact a misappropriation of the concept of the Mediterranean diet… Of course, devised by nutrition scientists, NutriScore is in no way opposed to the Mediterranean diet. The basic foods in this model are well ranked by Nutri-Score.
If cheeses and cured meats (and not only Italian ones) are classified mostly as D and sometimes as E, this is because they contain high amounts of saturated fat and salt and are also caloric. However, like all products classified as D or E, they may well be consumed as part of a balanced diet, but in limited quantity/frequency (in line with the principles of the Mediterranean diet and Nutri-Score). These products, excellent gastronomically and part of a remarkable culinary heritage, have a perfect place in a balanced diet. However, as the NutriScore D or E indicates, their consumption should be reasonable and too frequent consumption should be avoided.
And in these categories of foods to be restricted (meats, cheeses), we convey the message to choose those that have a PDO/PGI. Although PDO/PGI marks are not a guarantee of good nutritional quality, the fact that they are produced according to recognized ancestral knowledge that adheres to a specific specification and virtuous production methods are respectable elements that should be valued and supported. But beware, these brands never include the concept of “nutritional quality” in their definition (this is not their role). It is therefore wrong to suggest that the display of these brands gives these food products a nutritional quality that they do not have. Even with a PDO or PGI label, cured meats or cheeses high in fatty acids and salt and high in calories remain high in fatty acids and salt and high in calories. Being part of the gastronomic heritage has nothing to do with good nutritional quality for health. These foods, like all others, must therefore play the game of nutritional transparency, which must complement labels that reflect other types of product interest. The Nutri-Score indication on these products is perfectly in line with the concept of “consume less but better”… Given the same budget, if consumption is ultimately to be limited as indicated by the Nutri-Score, PDO/PGI labels allow choices in these categories to be steered toward quality, local, artisanal, and high sensory quality products.
One can imagine that if the Nutri-Score opposed the nutritional recommendations of the Mediterranean diet, it would not be so supported by nutrition experts internationally: more than 400 experts at the European level, numerous European societies specializing in the fields of nutrition, public health, oncology, cardiovascular disease, pediatrics, and numerous organizations such as the WHO’s International Agency for Research on Cancer (IARC), the European Academy of Pediatrics, theEuropean Childhood Obesity, which demand, on the basis of the scientific dossier alone, that the Nutri-Score become the single, mandatory nutrition logo for all of Europe.
4) Do you have any official data on the obesity outcomes of NutriScore labeling in France (or other countries where Nutri-score is widely used) in recent years? Have you asked families to feed themselves Nutri-score labeled foods for years, thus scientifically and not just empirically noting the real beneficial effects-if any-on the population?
In order to objectively assess the impact of any public health measure on the incidence of chronic diseases, it is necessary to have a sufficient amount of time, which was not the case with the NutriScore, which has only been implemented since 2017. This is all the more true because when it was officially adopted in France in 2017, after a long battle against industrialists and the lobby who have gone to great lengths to prevent its implementation (although its adoption is not mandatory for now due to European regulations), only 6 companies immediately decided to display it on their products (there were none when it was proposed by scientists in 2014). Under pressure from scientists and public health actors and strong consumer demand, we have seen in France (and then in the other 6 countries that have adopted it-Belgium, Germany, Luxembourg, the Netherlands, Spain, and Switzerland) a gradual increase in the number of food manufacturers and distributors who, after resisting, have finally adopted it (although some large groups refuse to expose it and continue to fight it, such as Coca Cola, Ferrero, Mars, Mondelez, Lactalis, Unilever international, Kraft).
Therefore, in order to objectively assess the effect of a nutritional logo (NutriScore or other) on the general population, a longer exposure period must be waited. In any case, it is unthinkable that a nutritional logo alone can solve all nutritional problems and in particular the problem of obesity. To be effective in the nutritional prevention of chronic diseases (including obesity), it is necessary to put in place ambitious public health nutrition policies commensurate with the challenges these diseases pose. These policies should combine a variety of measures, including nutrition education, information, communication, regulation of advertising and marketing food, taxation/subsidy systems based on the nutritional quality of food, actions on food supply quality, social measures to promote access to food of good nutritional quality for the poorest, etc. The Nutri-Score is one of the elements of these policies. Its purpose is to help consumers, at the time of purchase, steer their choice toward foods of better nutritional quality, thereby improving their dietary intake and nutritional status and, ultimately, their health.
Obviously, it is not possible, as is often the case in the field of nutrition, to conduct randomized trials comparing, as you suggest, a population shopping in stores where the NutriScore is displayed on the products versus a population shopping in supermarkets without the Nutri-Score, over a long period of time and to monitor the impact on the subjects’ weight. This is not feasible, but we have nutritional surveillance indicators that will allow us to study the issue in terms of determinants of obesity evolution in ongoing prospective cohorts. But this is not possible for the NutriScore as it is for any other nutritional logo, including the NutrInform!
However, I would like to mention that there are several studies conducted as part of large cohorts in France (15) (SU.VI. MAX, NutriNet-Santé), Spain (16) (SUN, ENRICA), and Europe (17) (EPIC with more than 500,000 participants in 10 countries), on large populations followed for many years (between 6 and 17 years) in terms of nutrition and health, which have shown that individuals who consume foods less highly ranked on the NutriScore scale have a higher risk of developing cancer, cardiovascular disease, metabolic syndrome, or excessive weight gain. Cohort studies have also shown, in large sample sizes, that consumption of foods well ranked on the Nutri-Score scale was prospectively associated with lower weight gain and lower incidence of obesity.
In addition, a simulation study, which considered the effects obtained from the NutriScore in a randomized trial, estimated that nearly 3.4 percent of diet-related chronic diseases could be prevented by its use, which is far from negligible for a public nutrition policy.
Thus, although we cannot expect the implementation of the Nutri-Score to solve the obesity problem by itself, it is a simple measure that has been scientifically proven to have an impact on the risk of obesity and diet-related chronic diseases (cancer, cardiovascular disease, diabetes, metabolic syndrome, etc.) and thus to help reduce their incidence.
5) The most important foods for cancer prevention are fresh foods (e.g., vegetables and fruits) and whole grains, which are rich in fiber and antioxidants. These are unpackaged foods, which therefore do not fall under the Nutri-Score classification. Is this not a serious shortcoming with respect to the goal of educating the population about nutrition?
When it was conceived and proposed by the independent academic experts, it was already planned to extend the Nutri-Score to mass catering and raw products sold in bulk (not prepackaged). In addition, although not directly affected by the NutriScore, fresh produce sold in bulk, especially fruits and vegetables, legumes, and whole grain products (unsweetened and unsalted) Which are particularly interesting in terms of chronic disease prevention (and particularly cancer prevention) are, of course, very well ranked by the Nutri-Score (They are then assessed by the Nutri-Score).
Over the past three years, work has been done with relevant ministries and scientific experts in the field to extend the Nutri-Score to these different contexts (unlike prepackaged products, which have a label that presents nutritional values, validated rules are needed to calculate the NutriScore for products without a nutrition label). These extensions are expected to be introduced in France on a trial basis in 2023, thus solving the problem.
However, there are already some fresh fruits and vegetables sold pre-packaged (and thus already favorably labeled by Nutri-Score) and industrial (frozen, canned, etc.) that contain significant amounts of fruits and vegetables, fiber-rich whole grains, etc., and thus contribute to the total intake of these favorable nutritional elements, which have been recognized as helpful in reducing the risk of cancer (and other chronic diseases). Of course, foods that contain these favorable elements are evaluated by the Nutri-Score, which in its calculation algorithm positively takes into account the percentage of fruits and vegetables, legumes, fiber content etc., and, conversely, negatively of nutrients whose consumption is unfavorable in terms of risk of cancer and other chronic diseases (salt, sugar, saturated fat).
Overall, given the elements considered in its construction and as demonstrated by prospective cohort studies, the NutriScore should already have a favorable effect on prepackaged products, particularly in terms of reducing cancer risk. And its extension to fresh produce sold in bulk is likely to boost its performance in this area even more. But even before its extension, a post-hoc study (18) based on the results of a randomized trial showed that the Nutri-Score tended to increase the purchase of products not covered by it, such as fruits. Thus, the Nutri-Score does not seem to lead to an increase in the purchase of prepackaged industrial products, quite the contrary.
To convince us of the value of affixing the Nutri-Score to all foods, even raw or bulk foods, I would again cite the large prospective cohort studies including very large samples with many years of follow-up, developed in France (SU.VI. MAX and NutrInet-Santé), Spain (SUN and ENRICA cohorts), and the European EPIC cohort (471,000 participants from 10 countries followed for 15 years), analyzing the relationship between food consumption and cancer occurrence (analysis of 49,000 cancers that appeared during follow-up), which showed, at the individual level, that individuals who consume foods better ranked on the Nutri-Score scale (including fresh, unpackaged produce in these analyses) have a lower risk of cancer (and lower cancer mortality).
Based on this extensive work, associations of cancer experts from many countries and the WHO International Agency for Research on Cancer (IARC/WHO) (19) have highlighted The superiority of the NutriScore over other nutritional logos and have called for its adoption in Europe to help consumers reduce the risk of noncommunicable diseases such as cancer.
If cancer experts and the IARC support the Nutri-Score as a tool to help reduce cancer risk, you cannot accuse it of failing in this area!
6) The Nutri-score has been criticized by nutritionists because it assigns high scores to ultra-processed foods. Consumers can replace high-fat foods with seemingly healthier but highly processed (and higher Nutri-score) foods. Is this statement correct?
It is not the “nutritionists” in general, especially those who are independent and without conflicts of interest, who raise these criticisms, but more often the economic lobbies (especially some agricultural and union sectors that try to defend meats and cheeses) and political figures who use this argument to try to scuttle Nutri-Score.
Again, this type of criticism is related to a lack of understanding of what a nutritional logo can do, or a desire to dishonestly instrumentalize the Nutri-Score to discredit it, but in any case it is fake news to make people believe that the Nutri-Score would give good overall grades to ultra-processed foods. This is absolutely false!
Some less thoughtful critics criticize the Nutri-Score because it does not take into account ultra-processed foods in its calculation.
What is the reality of this fact?
(a) It is important to know that all “nutritional” logos only inform about the nutritional composition and not about the degree of processing, especially not about ultra-processing
It should be remembered that by definition a “nutritional” logo provides information on the nutritional composition/quality of foods and, for scientific reasons, does not include in its calculation other health aspects of foods that are not nutritional in nature, such as ultra-processing (related to industrial processes), the presence of additives, newly processed compounds, and pesticide residues. Therefore, a nutrition logo cannot be asked to give more information than it can. The following is a brief explanation of the reality of the problem.
– It is clear that epidemiological studies confirm the importance of both the nutritional composition and the ultra-work dimension in the development of chronic diseases, independent of each other. Important as they are, these two dimensions are not integrated into any nutritional logo in the world because it is not possible, in the current state of scientific knowledge, to consider them together in the calculation of a single indicator and thus aggregate them into a single logo. This is not a specific problem related to the Nutri-Score. Furthermore, Nutrinform, like the multiple British traffic lights or the Chilean warnings, which are also nutrition logos, does not provide information on whether a food is ultra-processed or not.
– Synthesizing these two health dimensions of foods into a single reliable indicator that can comprehensively predict health risk would clearly be the dream of any Public Health Nutrition actor in the interest of consumers. But it is no accident and certainly not due to incompetence that no research group or public health facility in the world, nor any independent national or international expert committee, nor WHO has been able to design such a synthetic indicator to date. For example, there is still a lack of information on the specific factors of ultra-processed foods that would be particularly problematic for health. Years of research are also needed before the relative impact of each dimension on health can be quantified and a possible weighting system derived.
– It should be remembered that several studies have shown that the deleterious effect of ultra-processed foods remains significant, even after adjusting the nutritional quality of the diet. However, the effect of the nutritional component is also independent of the level of processing/ultra-processing: in the NutriNet-Santé cohort, the associations between the nutritional score underlying the Nutri-Score and cancer risk remain significant even after adjusting for the portion of ultra-processed foods in the diet.
In total, therefore, it is clear that nutritional composition and the level of ultratransformation are two dimensions that may independently impact chronic disease risk through several specific mechanisms and probably in complementary ways.
It is therefore necessary to accept that complementary information on these different dimensions (Nutri-Score and ultratransformation) should be provided to consumers separately and, if possible, in a combined graphic form to make the information easier to read. Regarding the Nutri-Score, it is proposed to supplement the classic colored nutritional logo from A to E with a black band around it, making it easy to recognize whether the food is an ultra-processed product. (20)
But even though the Nutri-Score focuses only on the nutritional composition of foods, this already means a great deal in terms of public health (as evidenced by the numerous scientific studies highlighting its favorable effect on consumer choice and its expected impact on morbidity and mortality.
(b) Does the Nutri-Score display on prepackaged foods encourage the consumption of ultra-processed foods?
Scientifically, there are three studies that have tested the impact of Nutri-Score (versus no logos) on consumer purchase intentions in randomized controlled trials. (21) In the NutriScore group, participants tended to buy fewer food products and especially fewer prepackaged products, with a greater decrease in the number of low-quality foods. In addition, with the NutriScore, participants tended to buy less processed or ultra-processed foods, less cheese, cured meats, ultra-processed fish, sweet and savory products, sauces and condiments, and more fruits and unprocessed meat.
Interestingly, although the Nutri-Score only takes into account the nutritional composition of foods, these results suggest that it would have an effect on the type of foods purchased, with fewer ultra-processed foods. Several hypotheses have been put forward to explain this effect. The Nutri-Score could raise awareness among consumers in general about the impact of food choices on health and encourage healthier purchasing behaviors. In addition, the highlighting by Nutri-Score of misclassified foods would discourage consumers from buying them and encourage them to consume more of certain fresh foods that are considered healthy, such as fruits.
(c) How are ultra-processed foods classified by the Nutri-Score? Why can a small number of ultra-processed foods have a good nutritional composition?
Of course, the two dimensions, nutrition and ultra-processing, while different, partly overlap: there is a general association between the degree of processing and the nutritional quality of food as assessed by the NutriScore. However, if there is a concordance between being an ultra-processed food and, on average, of lower nutritional quality, it is not surprising that a small number of foods considered to be of better nutritional quality (and therefore with a good NutriScore) are ultra-processed foods: while 80 percent of ultra-processed foods are poorly ranked by the Nutri-Score, 8 percent are currently in A. This is the case, for example, with whole-wheat (and low-salt) bread or sweetened yogurt. The recent update of the algorithm by the European Scientific Committee Nutri-Score, which will take effect in 2023, will penalize sweet and savory products more, thus shifting ultra-processed products (sugary breakfast cereals, ready meals, pizzas, sugary drinks, etc.) to less good Nutri-Score scores and reducing the number of ultra-processed products classified as A (and B). But there will always be a small number of them, which is not abnormal since these two dimensions do not totally overlap but are on the contrary complementary, as explained above.
As mentioned above, nutritional composition and ultra-processing are not collinear but complementary, and while a small number of ultra-processed foods have a good Nutri-Score, some foods considered “not ultra-processed” according to the NOVA classification do not have good nutritional quality (they may be high in saturated fat, sugar or salt, etc.). Thus, among non- or only slightly processed foods (NOVA1), 7.4 percent are classified as D and 3.3 percent as E. For example, pure grape juice is NOVA1 and classified E by the NutriScore (because it contains more than 160 g sugar/liter). Similarly, among industrial processed (but not ultra-processed) foods classified as NOVA3, 32.5 percent are D and 16.3 percent E. This is the case, for example, with many cheeses, chocolates, etc.
No system has yet combined all these different dimensions into one logo. Although they cannot be combined in the same algorithm in a scientific way, can be associated in graphic form. This is the sense of our proposal to add a black border to the NutriScore to inform consumers in a complementary way that the food is ultra-processed.
7) According to Prof. Philippe Legrand-director of the Laboratory of Biochemistry of Human Nutrition at Agrocampus-INSERM-the algorithm penalizes high-fat foods and does not distinguish between different types of fats, some of which are essential for human health. Example: OMEGA 3 fatty acids, defined as “good” and necessary for the body’s well-being
In order to construct a nutrition logo and for its construction to be transparent to all (and verifiable by all), it is necessary to be able to rely on the composition data on food packages: these are the data made mandatory by the 2011 European regulation and appear in the nutrition declaration table on the back of food packages. However, you cannot ask a nutritional logo to include in its calculation information about the content of elements that are not included in the table. For example, these tables do not mandatorily include vitamin and mineral content, ratio of saturated to unsaturated fatty acids, omega-3 content (or other nutrients or elements of interest such as polyphenols, etc.). NutriScore (like all the other nutrition logos in the world) does not willfully “ignore” items that might be of interest, but it cannot consider them for a regulatory labeling request simply because these data are not available! Moreover, this is true for all nutritional logos, especially the Nutrinform, which does not even include these elements and includes fewer nutrients/nutritional elements than the NutriScore, which, for its part, takes into account (in addition to sugar, saturated fat, and salt), fiber content, protein, percentage of fruits and vegetables, legumes, and the most nutritionally favorable oils. It is surprising to reproach NutriScore for not taking into account different types of fats and not to reproach other nutritional logos such as Nutrinform, Multiple Semaphore, Warning (which take into account even fewer nutritional elements).
The NutriScore “penalizes” high-fat foods because they are high in energy density, and energy density is associated with excessive calorie consumption and thus risk of overweight and obesity. But beyond this point, it is capable-and even more so after its upgrade-of discriminating between foods based on levels of different types of fatty acids. In fact, while taking saturated fatty acids into account in the calculation, it indirectly takes into account the polyunsaturated fatty acid content. In fact, among the added fats, those with the highest polyunsaturated fatty acid content (up to B in the new version of the algorithm that will take effect in 2023) are canola and walnut oils. Olive oil, which is rich in monounsaturated fatty acids, will also be classified as B in the updated algorithm. Oily fish, which has high levels of polyunsaturated fatty acids, is also rated A or B in the Nutri-Score, while meat, which contains more saturated fat, will have a relatively lower rating.
It is true that the Nutri-Score, like the other nutritional logos, does not directly incorporate all the nutritional elements of interest into its calculation algorithm (since they are not available). But in any case, it should be remembered that the choice of nutrients and elements considered in the calculation of the NutriScore algorithm is based on very solid and numerous scientific studies. In fact, the calculation used to assign Nutri-Score scores/colors is based on a nutritional profiling system that was developed by research groups at the University of Oxford, initially to provide the U.K. Food Standards Agency (FSA) with tools to establish rules for regulating television advertising aimed at children. The score developed was the subject of a rigorous scientific process lasting many years, which involved extensive work to justify nutrients or elements retained in the algorithm, given their known health impacts, and to limit the number of elements through sensitivity studies to avoid redundancy among elements.
For example, it was shown that the consideration of fruits and vegetables in the calculation of the algorithm used for the NutriScore was a good proxy for vitamins, such as vitamin C, beta-carotene, etc.
This lengthy scientific work made it possible to keep in the final overall nutritional score only the useful and necessary items corresponding to the nutrients and elements whose consumption is to be restricted and those whose consumption is to be promoted. These are the composition data found in mandatory labeling tables or in the list of ingredients on the back of food packages. The fact that the compositional data are available and accessible to all and are based on a public algorithm allows full transparency and the possibility for all to verify the correct color/letter assignment of the NutriScore.
However, it should be kept in mind that, through its proxies, the algorithm takes into account many other elements besides the list of those displayed for calculation.
8) How do you see the European debate on this issue evolving and what kind of single label will be achieved?
Only science should guide policy decisions in the field of public health. The choice of a single harmonized nutritional logo for Europe, as envisioned by the European Commission under the Farm to Fork strategy, must meet this requirement alone, to ensure that such a logo is conducive to consumer health, which must be the main goal of such a measure.
In this respect, NutriScore is the only nutrition logo that has been scientifically proven to be effective and beneficial to consumers and public health, superior to other logos that exist in other countries or are supported by pressure groups.
Overall, there are strong arguments in favor of choosing the NutriScore as the single, mandatory nutrition logo for Europe:
– the numerous scientific studies conducted over several years in about 20 countries validating the algorithm behind the NutriScore calculation and its effectiveness in helping consumers make healthier food choices (including studies in virtual supermarkets, experimental stores, and real supermarkets). Since 2014, more than 100 studies have been published in international peer-reviewed journals demonstrating its efficacy and superiority over other labels, particularly in disadvantaged populations,
– The recent update of the NutriScore by a scientific committee composed of European experts independent of the agribusiness lobby, which will come into effect in 2023 and allows for the improvement of some identified limitations of the Nutri-Score to achieve better alignment of the NutriScore with public health nutrition recommendations and thus further improve its performance,
– the findings of the recent EC Joint Research Center (JRC) report (published in September 2022) showing that consumers, including low-income consumers, seem to prefer simple, colorful, evaluative front labels that are easier to understand than more complex, non-evaluative, monochrome labels. NutriScore holds all the cards in terms of positive attributes regarding its usefulness and effectiveness, as it is classified by the JRC as a simple, concise, colorful, and interpretive nutrition logo,
– The results of the public consultation launched by the EC between December 2021 and March 2022 have shown that consumer groups, citizens, NGOs, research and education facilities, and public authorities are in favor of a nutrition logo that provides graded information on the overall nutritional quality of food (which fully corresponds to the characteristics of the NutriScore).
– the strong support of consumer associations in Europe (including BEUC, composed of 46 independent consumer organizations from 32 European countries) and NGOs such as FoodWatch present in several European countries,
– formal adoption and implementation in 7 European countries (France, Belgium, Germany, Spain, the Netherlands, Luxembourg and Switzerland) demonstrating the feasibility of its deployment.
Dario Dongo
Notes
(1) https://www.ncbi.nlm.nih.gov/pmc/articles/PMC6165438/
(2) https://cdn.who.int/media/docs/default-source/healthy-diet/guidingprinciples-labelling-promoting-healthydiet.pdf?sfvrsn=65e3a8c1_7&download=true https://apps.who.int/iris/bitstream/handle/10665/336988/WHO-EURO-2020-1569-41320-56234-eng.pdf?sequence=1&isAllowed=y
(3) https://ijbnpa.biomedcentral.com/articles/10.1186/s12966-020-01053-z
https://www.mdpi.com/2072-6643/12/5/1303
(4) https://www.mdpi.com/2072-6643/12/8/2307
(5) https://www.sciencedirect.com/science/article/abs/pii/S0749379715007242?via%3Dihub
https://www.sciencedirect.com/science/article/abs/pii/S0007996016300347 https://www.sciencedirect.com/science/article/abs/pii/S0007996016300347 https://pubmed.ncbi.nlm.nih.gov/31219721/
https://academic.oup.com/erae/article-abstract/47/2/785/5552528?redirectedFrom=fulltext
https://papers.ssrn.com/sol3/papers.cfm?abstract_id=3567974 https://papers.ssrn.com/sol3/papers.cfm?abstract_id=3567974 https://bmjopen.bmj.com/content/11/2/e041196.full
(6) https://www.tandfonline.com/doi/abs/10.1080/09637486.2020.1796932 https://www.tandfonline.com/doi/full/10.1080/09637486.2021.1873918 https://www.mdpi.com/2304-8158/10/12/2958
(7) https://www.mdpi.com/2072-6643/14/17/3511
https://www.lesjfn.fr/programme
https://academic.oup.com/eurpub/advance-article/doi/10.1093/eurpub/ckad002/6994013?login=false
(8) https://www.ncbi.nlm.nih.gov/pmc/articles/PMC3876974/
https://pubmed.ncbi.nlm.nih.gov/17214504/
https://pubmed.ncbi.nlm.nih.gov/27802480/
(9) https://publications.jrc.ec.europa.eu/repository/handle/JRC130125
(10) https://pubmed.ncbi.nlm.nih.gov/21241532/
(11) https://publications.jrc.ec.europa.eu/repository/handle/JRC130125
(13) https://www.mdpi.com/2072-6643/14/23/5097
(14) https://www.sciencedirect.com/science/article/abs/pii/S0261561420303599
(15) https://academic.oup.com/jn/article/145/10/2355/4616061
https://pubmed.ncbi.nlm.nih.gov/26393396/
https://pubmed.ncbi.nlm.nih.gov/32878658/
https://www.sciencedirect.com/science/article/abs/pii/S0167527317311221?via%3Dihub
(16) https://www.sciencedirect.com/science/article/abs/pii/S0261561420303599
https://academic.oup.com/ajcn/article/113/5/1301/6155958
(17) https://www.ncbi.nlm.nih.gov/pmc/articles/PMC6143197/
https://pubmed.ncbi.nlm.nih.gov/32938660/
(18) https://ijbnpa.biomedcentral.com/articles/10.1186/s12966-021-01108-9
(19) https://www.iarc.who.int/featured-news/brief2-nutri-score/
(20) https://www.medrxiv.org/content/10.1101/2022.11.18.22282494v1
https://pubmed.ncbi.nlm.nih.gov/35923202/
(21) https://pubmed.ncbi.nlm.nih.gov/36038180/
https://pubmed.ncbi.nlm.nih.gov/33558350/
https://ijbnpa.biomedcentral.com/articles/10.1186/s12966-021-01108-9

Dario Dongo, lawyer and journalist, PhD in international food law, founder of WIISE (FARE - GIFT - Food Times) and Égalité.


 systems where he was invited to contribute, only to be censored to leave only room for Nutri(dis)inform advocates.)